Highlighting regions in terrain maps using ggmap and ggplot2
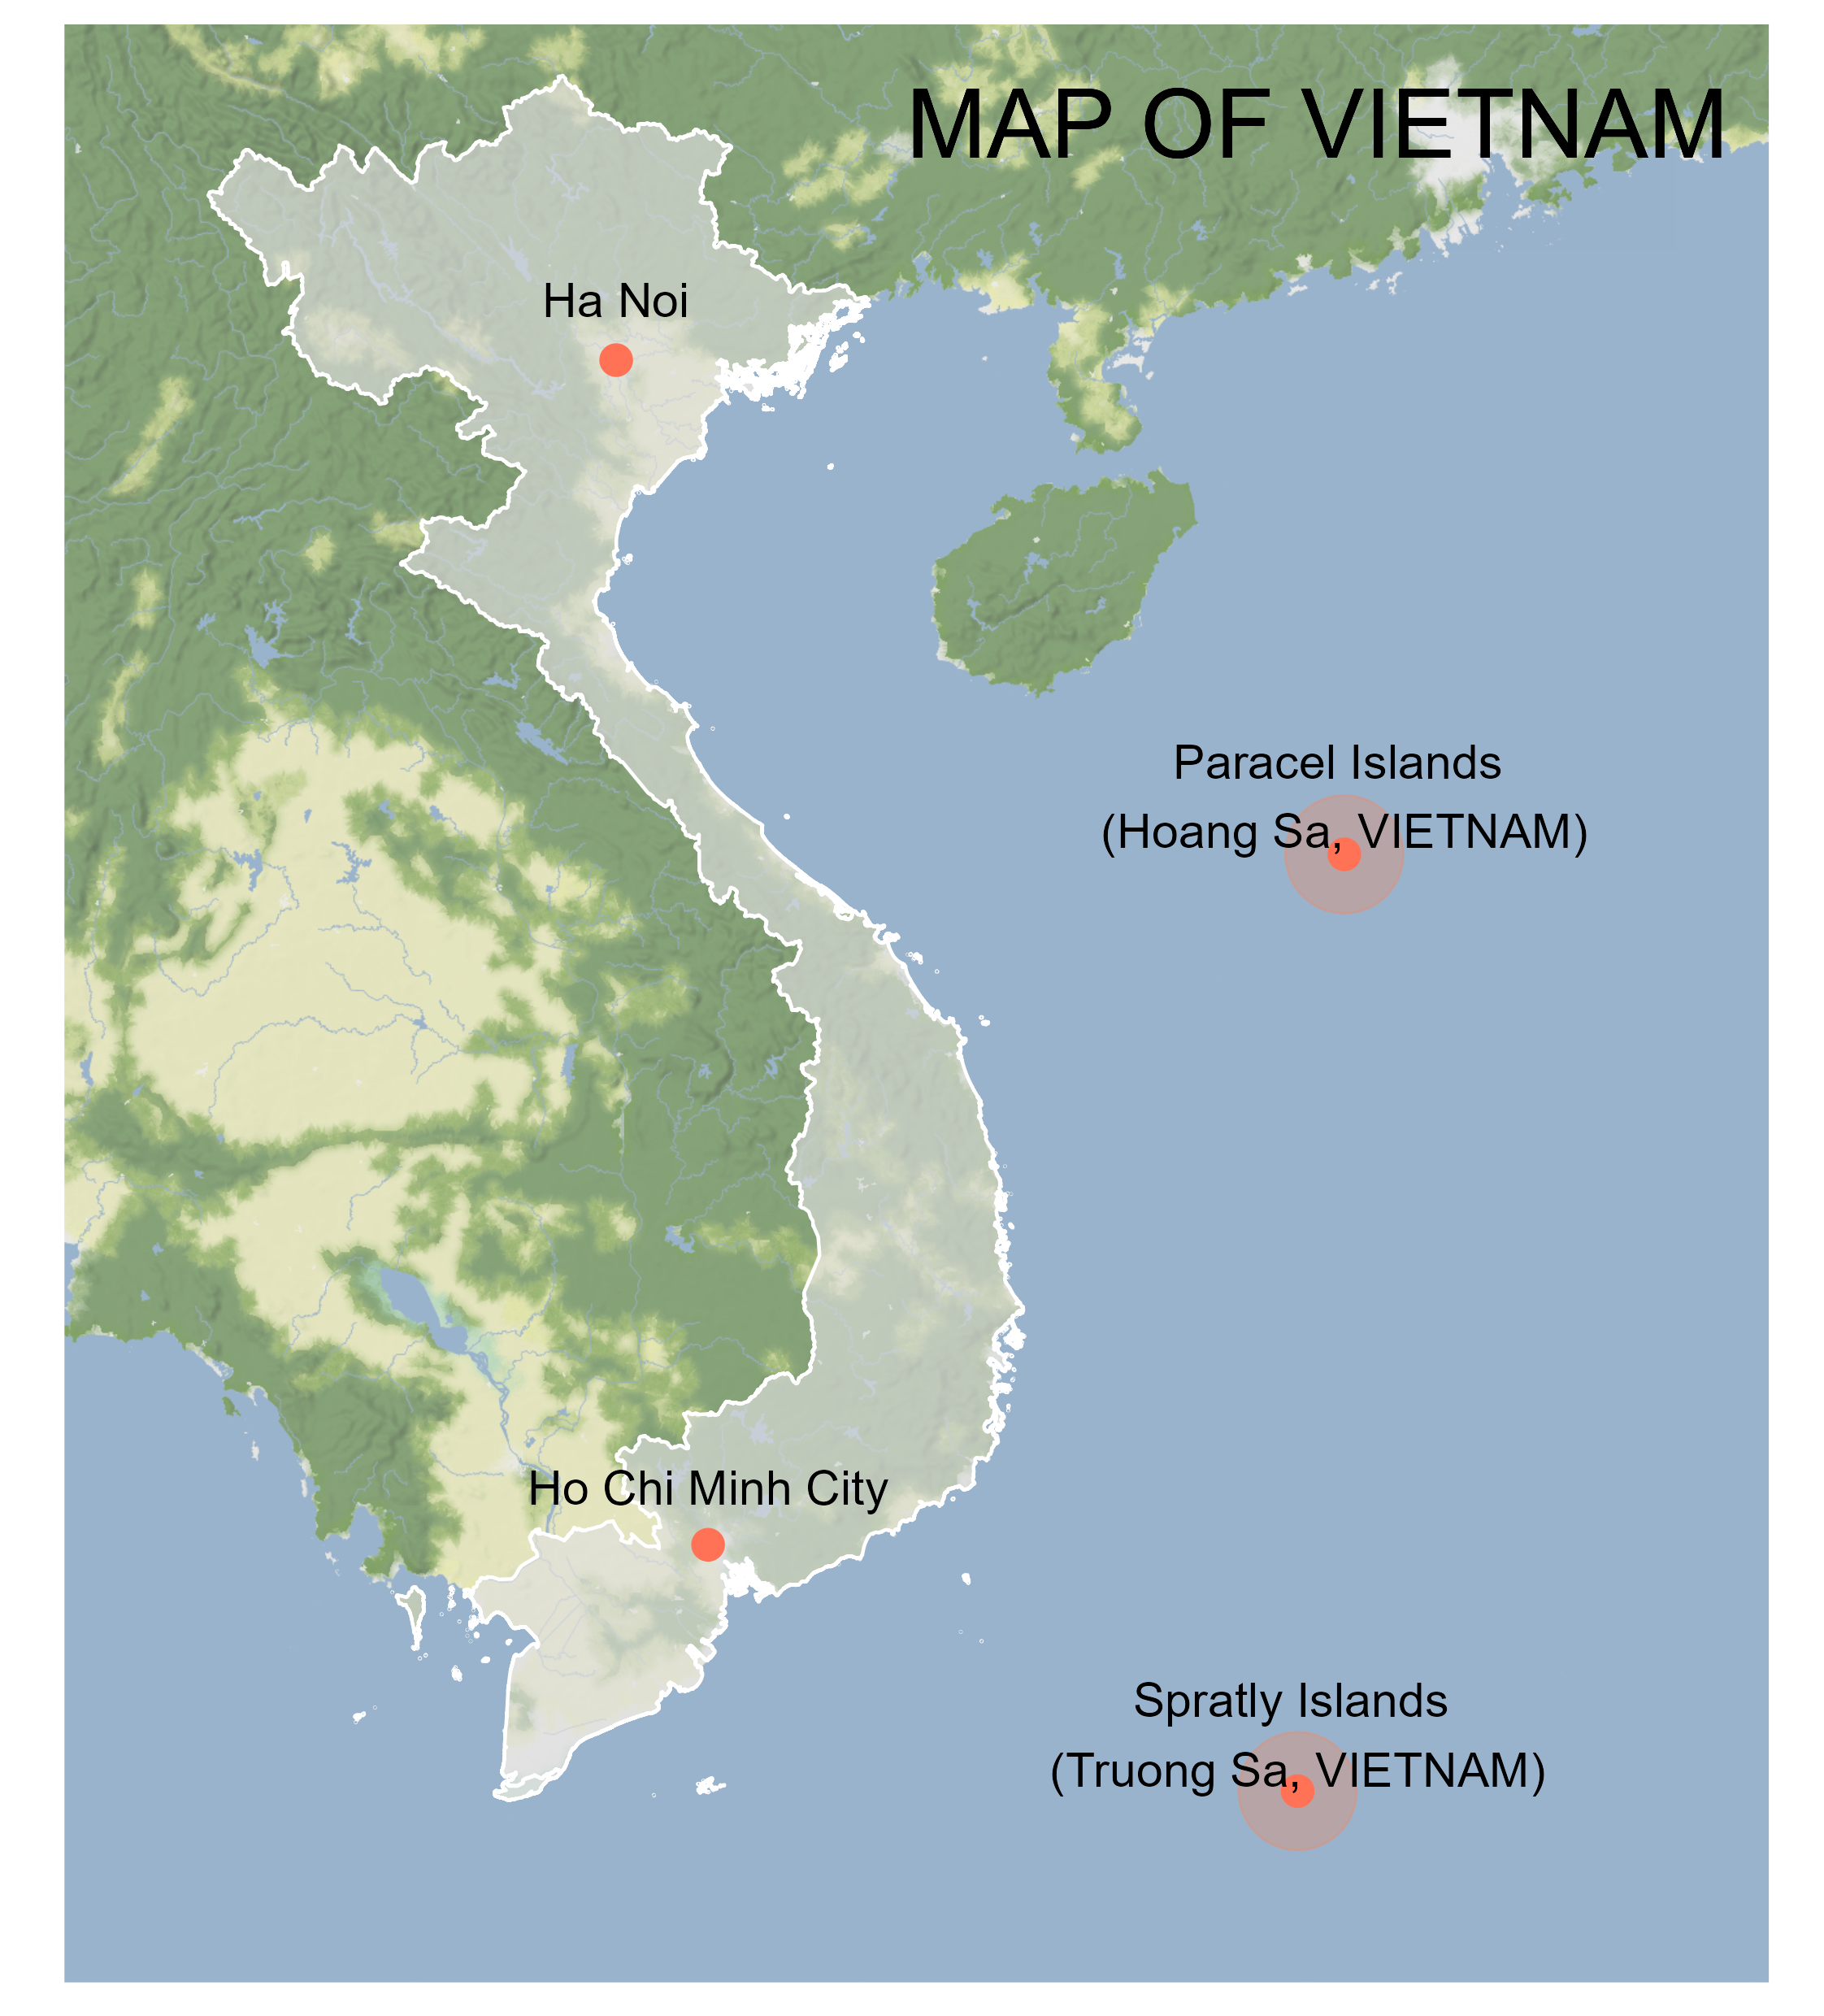
This blog post serves as a quick tutorial for creating terrain map in R using ggmap and ggplot2. The terrain map accentuates a designated region amid the surrounding landscape. Using Vietnam as an illustrative example, the post underscores the effectiveness of R in visualizing map.
The complete code for this visualization is available on Github.
library(tidyverse)
library(ggmap)
library(sf)
Step 1: Specify the boundaries of the map drawing rectangle
Set the plot boundaries using coordinate data.
The coordinate can be obtained from several websites, for example, bboxfinder.com.
longitude <- c(100.854490, 116.147458)
latitude <- c(6.945000, 23.812699)
Step 2: Get the stamen map of the plot
In this post, a Stamen map hosted by Stadia Maps is used as an example. To utilize Stadia Maps with ggmap, an API key is necessary. A free API key for non-commercial purposes can be obtained without requiring a credit card for sign-up. Quick tips for obtaining the API key can be found here.
- Enable Stadia Maps services in R using API key:
ggmap::register_stadiamaps(key = "YOUR-API-KEY")- Getting the background map:
background_map <- ggmap::get_stadiamap(bbox = c(longitude[1],
                                                latitude[1],
                                                longitude[2],
                                                latitude[2]),
                                       maptype = "stamen_terrain_background",
                                       # increase `zoom` to get higher resolution
                                       zoom = 7)
Step 3: Read the polygonal file to outline the boundary of Vietnam
The polygonal data can be downloaded from several websites, for example, diva-gis.
target_extent <- sf::st_read("data/VNM_gis/VNM_adm0.shp")Step 4: Convert shapefile to be compatible with ggplot2
target_shape <- # convert coordinates into correct Coordinate Reference System (CRS)
                st_transform(target_extent, crs = 4326) %>%
                # convert data type to be compatible with 'ggplot2' and 'ggmap'
                as_Spatial()
Step 5: Create the map using ggplot2
map <- ggmap(background_map) +
        geom_polygon(data = target_shape,
                     aes(x = long, y = lat, group = group),
                     colour = 'white',
                     fill = 'gray87',
                     alpha = 0.65,
                     size = 0.5) +
        theme(axis.title = element_blank(),
              axis.text = element_blank(),
              axis.ticks = element_blank(),
              plot.margin = margin(t = 0.1,
                                   r = 0.1,
                                   b = 0.1,
                                   l = 0.1,
                                   unit = "in"))
Step 6: Incorporate cities and islands into the map
Generate a dataframe containing coordinate data and site names.
site_df <- data.frame(site_name = c("Ha Noi",
                                    "Ho Chi Minh City",
                                    "Paracel Islands \n(Hoang Sa, VIETNAM)",
                                    "Spratly Islands \n(Truong Sa, VIETNAM)"),
                      site_latitude = c(21.028511, 10.823020, 16.83517, 8.64464),
                      site_longitude = c(105.804817, 106.629650, 112.33873, 111.91969))
Incorporate cities and islands into the map using ggplot2
map <- map +
        # add the areas of islands as large circles on the map
        geom_point(data = site_df %>% filter(str_detect(site_name, "Islands")),
                   mapping = aes(x = site_longitude,
                                 y = site_latitude),
                   size = 16,
                   color = "coral",
                   alpha = 0.3) +
        # add the cities and primary islands as points
        geom_point(mapping = aes(x = site_longitude,
                                 y = site_latitude),
                   data = site_df,
                   size = 4,
                   colour = "coral1") +
        # add names of cities and islands as text labels
        geom_text(mapping = aes(x = site_longitude,
                                y = site_latitude + 0.5,
                                label = site_name),
                  data = site_df,
                  size = 5)
Step 7: Add the map title
map <- map +
        geom_text(mapping = aes(x = 112.1, y = 23, label = "MAP OF VIETNAM"),
                  size = 10,
                  color = "black")
Further information
- Map Style Library by Stadia Maps Documentation
- ggmap Documentation